 21:00
21:00
 Juan MC Larrosa

Production Costs and Firm Profits
The firm's primary objective in producing output is to maximize profits. The production of output, however, involves certain costs that reduce the profits a firm can make. The relationship between costs and profits is therefore critical to the firm's determination of how much output to produce.
Explicit and implicit costs. A firm's explicit costs comprise all explicit payments to the factors of production the firm uses. Wages paid to workers, payments to suppliers of raw materials, and fees paid to bankers and lawyers are all included among the firm's explicit costs.
A firm's implicit costs consist of the opportunity costs of using the firm's own resources without receiving any explicit compensation for those resources. For example, a firm that uses its own building for production purposes forgoes the income that it might receive from renting the building out. As another example, consider the owner of a firm who works along with his employees but does not draw a salary; the owner forgoes the opportunity to earn a wage working for someone else. These implicit costs are not regarded as costs in an accounting sense, but they are a part of the firm's costs of doing business, nonetheless. When economists discuss costs, they have in mind both explicit and implicit costs.
Accounting profits, economic profits, and normal profits. The difference between explicit and implicit costs is crucial to understanding the difference between accounting profits and economic profits. Accounting profits are the firm's total revenues from sales of its output, minus the firm's explicit costs. Economic profitsare total revenues minus explicit and implicit costs. Alternatively stated, economic profits are accounting profits minus implicit costs. Thus, the difference between economic profits and accounting profits is that economic profits include the firm's implicit costs and accounting profits do not.
A firm is said to make normal profits when its economic profits are zero. The fact that economic profits are zero implies that the firm's reserves are enough to cover the firm's explicit costs and all of its implicit costs, such as the rent that could be earned on the firm's building or the salary the owner of the firm could earn elsewhere. These implicit costs add up to the profits the firm would normally receive if it were properly compensated for the use of its own resources—hence the name, normal profits.
Fixed and variable costs. In the short-run, some of the input factors the firm uses in production are fixed. The cost of these fixed factors are the firm's fixed costs. The firm's fixed costs do not vary with increases in the firm's output.
The firm also employs a number of variable factors of production. The cost of these variable factors of production are the firm's variable costs. In order to increase output, the firm must increase the number of variable factors of production that it employs. Therefore, as firm output increases, the firm's variable costs must also increase.
To illustrate the concepts of fixed and variable costs, consider again the example of a single firm operating in the short-run with a fixed amount of capital, 1 unit, and a variable amount of labor. Suppose the cost of the single unit of capital is $100 and the cost of hiring each worker is $20. The firm's fixed and variable costs are reported in Table 1 .
|
The fourth column of Table 1 reports the variable cost that the firm incurs from hiring 1 to 6 workers at $20 each, while the fifth column reports the fixed cost of the single unit of capital that the firm employs. The fixed cost of $100 is the same—no matter how many units of output the firm produces.
Total and marginal costs. The firm's total cost of production is the sum of all its variable and fixed costs. The firm's marginal cost is the per unit change in total cost that results from a change in total product. The concepts of total and marginal cost are illustrated in Table 1 . The sixth column of this table reports the firm's total costs, which are simply the sum of its variable and fixed costs. The seventh column reports the marginal cost associated with different levels of output.
For example, when the firm increases its total product from 0 to 5 units of output, the change in the firm's total costs is $120 – $100 = $20. The marginal cost for the first 5 units of output is therefore $20/5 = $4. Similarly, when the firm increases its total product by 10 units, from 5 to 15 units of output, its total costs increase by $140 - $120 = $20. The marginal cost for the next 10 units produced is therefore $20/10 = $2.
Marginal cost and marginal product. The firm's marginal cost is related to itsmarginal product. If one calculates the change in total cost for each different level of total product reported and divides by the corresponding marginal product of labor reported, one arrives at the marginal cost figure. The marginal cost falls at first, then starts to rise. This behavior is a consequence of the relationship between marginal cost and marginal product and the law of diminishing returns. As the marginal product of the variable input–labor– rises, the firm's total product incresses at a rate that is greater than the rate of new workers hired. Consequently, the firm's marginal costs will be decreasing. Eventually, however, by the law of diminishing returns, the marginal product of the variable factor will begin to decline; the firm's total product will increase at a rate less than the rate at which new workers are hired. The result is that the firm's marginal costs will begin rising.
Average variable, average fixed, and average total costs. The firm's variable, fixed, and total costs can all be calculated on an average or per unit basis. Table 2reports the average variable costs, average fixed costs, and average total costs for the numerical example of Table 1 .
|
When the firm produces 27 units of output, for example, the firm's variable costs from Table 1 are $80. The average variable cost per unit of output is therefore $80/27 = $2.96, as reported in Table 2 . The fixed cost corresponding to 27 units of output is $100; therefore, the average fixed cost per unit of output is $100/27 = $3.70. The total cost of 27 units of output is $180; so, the average total cost is $180/27 = $6.66.
Graphical depiction of costs. The variable, fixed, and total costs reported in Table1 are shown in Figure 1 . The marginal cost reported in Table 1 along with the average variable, average fixed, and average total costs reported in Table 2 are shown in the graph in Figure 1 (b).
| |||
| |||
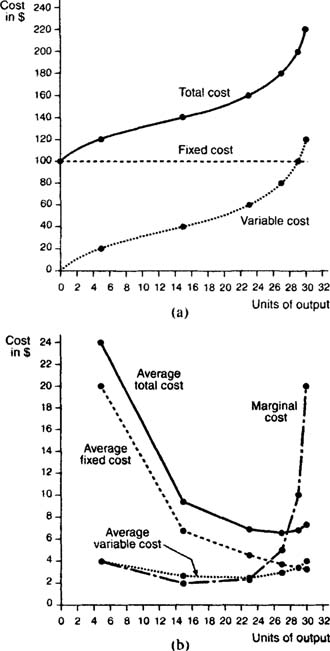
When costs are depicted graphically, they are referred to as cost curves. Figures 1(a) and 1 (b) reveal some of the interesting relationships that exist among the various cost curves. Note first that the total cost curve is just the vertical summation of the variable cost curve and the fixed cost curve. This also holds true for the average total cost curve, which is just the vertical summation of theaverage variable cost curve and the average fixed cost curve.
Second, note the relationship between the marginal cost curve and the total and variable cost curves. The marginal cost curve reaches its minimum at the inflection point of the total and variable cost curves. This should not be surprising because the slope of the total and variable cost curves reveals the rate at which the firm's costs change as output increases, which is precisely what marginal cost measures.
Finally, notice that the marginal cost curve intersects both the average variable cost curve and the average total cost curve at the minimum points of both curves. This is in accordance with the marginal-average rule, which states that when marginal cost lies below average cost, average cost is falling. When marginal cost lies aboveaverage cost, average cost is rising. It follows, then, that the marginal cost curve will intersect the average variable and average total cost curves at each of these curves' minimum points.
 Posted in:


0 comentarios:
Publicar un comentario